• Skip to main content
  • Skip to secondary menu
  • Skip to primary sidebar
  • About Us
  • Terms of Use
  • Privacy Policy
  • Disclaimer
  • Contact Us
  • Sitemap

BDS Notes

BDS notes, Question and Answers

  • Public Health Dentistry
  • Periodontics
  • Pharmacology
  • Pathology
  • Orthodontics
    • Anchorage In Orthodontics
    • Mandibular Growth, Functional Matrix
    • Retention and Relapse
  • General Surgery
    • Cysts: Types, Causes, Symptoms
    • Maxillofacial Fractures, Disorders, and Treatments
    • Lymphatic Disorders
    • Neurological and Facial Disorders
  • Temporal And Infratemporal Regions
    • Spinal and Neuroanatomy
  • Dental Materials
    • Dental Amalgam
Home » BSc Nursing 3rd Year Nursing Research And Statistics Chapter 13 Analysis Of Data Question And Answers

BSc Nursing 3rd Year Nursing Research And Statistics Chapter 13 Analysis Of Data Question And Answers

September 9, 2023 by Kristensmith Taylor Leave a Comment

Analysis of Data

Question 1. Data presentation and Interpretation.
Answer:

  • Data presentation and analysis play an essential role in every field. An excellent presentation can be a deal maker or deal breaker.
  • Some people make an increasable useful presentation with the same set of facts and figures that are available to others.


Analysis of Data Presentation of data

Read And Learn More: BSc Nursing 3rd Year Nursing Research And Statistics Previous year Question And Answers 

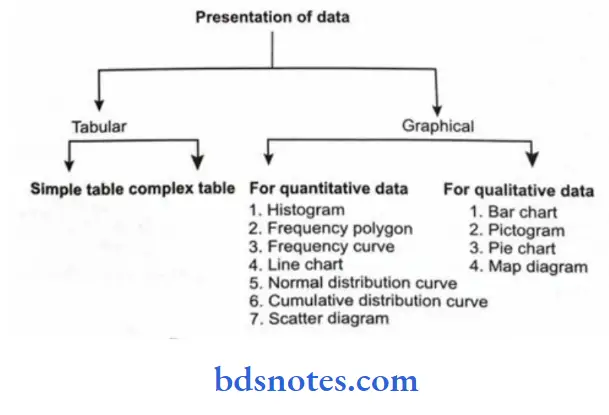
  1. Presentation of data is generally done by these two methods:
    1. Tabular presentation,
    2. presentation
  2. Tabulated data will give some information and also allow for further analysis.
  3. The columns and rows in a table make eye strain and there are chances of poor visual impression of data presented in a tabular form.
  4. In such circumstances data can be presented in the form of picture, diagram or figure which will help in good comparison through good visual impression.
  5. The graphs and diagrams are of utmost importance in creating interest from the observational data.
  6. One should take care to select major data presentable in graph or diagram.
  7. The presentation of data by diagram proves a very considerable aid and has much to commend it, if certain basic principles are not forgotten.
  8. Main objective of diagram is to help the eye to grasp series of numbers and to grasp the meaning of series of data and also to assist intelligence.

Filed Under: Nursing Research And Statistics

Reader Interactions

Leave a Reply Cancel reply

Your email address will not be published. Required fields are marked *

Primary Sidebar

Recent Posts

  • Retention and Relapse in Orthodontics: Causes, Types, Functions
  • Mandibular Growth, Functional Matrix Theory & Space Maintainers in Orthodontics
  • Hawley’s Appliances
  • Cantilever Springs
  • Adams Clasp Theory And Fabrication
  • Canine Retraction Classification in Orthodontics
  • Space Maintenance in Orthodontics
  • Distal Shoe Space Maintainer
  • Types Of Fixed Space Maintainers
  • Preventive Care In Orthodontics
  • Space Maintainers: Classification, Contraindications, Advantages and Disadvantages
  • Prenatal And Postnatal Growth Of Mandible
  • Functional Matrix Theory With Special Reference To The Mandible
  • Labial Bows
  • Components Of Removable Appliance
  • Cervical Vertebral Maturation Indicator
  • Skeletal Maturity Indicator in Orthodontics
  • Hand Wrist Radiography
  • Factors Affecting Retention And Relapse In Orthodontics
  • Begg’s Retainer in Orthodontics

Copyright © 2025 · Magazine Pro on Genesis Framework · WordPress · Log in